There’s a Map for That: Visualizing the Transatlantic Slave Trade
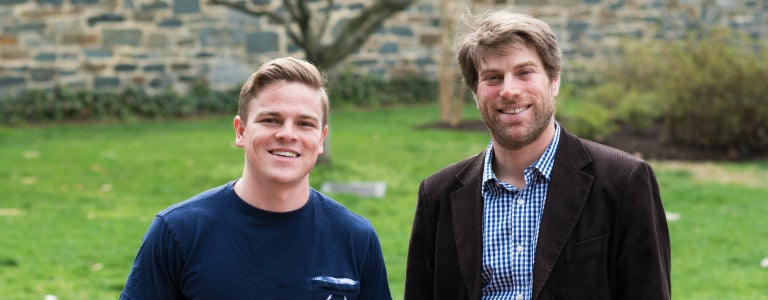
Computer Science major Matthew Burdumy (C’15) and Associate Professor of History Adam Rothman are the team behind the Transatlantic Slave Trade Visualization. Photo by Georgetown College.
May 5, 2015—When computer science major and George F. Baker Scholar Matthew Burdumy (C’15) took Associate Professor Adam Rothman’s History of the Atlantic World course last fall, he thought he was fulfilling one of his final core requirements before graduation. But what he took away from the class turned out to be much larger.
Burdumy and Rothman are the team behind the Trans Atlantic Slave Trade Visualization, a series of three animated heat maps that displays more than 35,000 slaving voyages from 1500 to 1870.
“Other maps that represent this data are all static—they’re like snapshots of a particular time in the overall volume of the trade,” explained Rothman. “Unless you look at several different maps in succession, they don’t really give you a sense of growth and change over time.”
The lack of such a tool is precisely the reason that Rothman took note when he learned, through an e-mail signature, that Burdumy was majoring in computer science. He offered Burdumy the option to work on the visualization in lieu of one of one of the course’s final papers.
“We wanted to make something dynamic,” Burdumy said.
With Rothman’s guidance, Burdumy applied his skills as a programmer to geolocate data from the Transatlantic Slave Trade Database—a free digital resource that documents more than 35,000 African slave voyages to the Americas—in order to create the maps. But designing and animating the maps wasn’t the difficult part, according to Burdumy.
“What you see on our website is just finished data,” he explained. “The challenge was getting the data to that point.”
While the slave trade database provides a wealth of information, it didn’t lend itself to the process of geolocation. So Burdumy wrote a script using Python (a programming language) to translate the database’s place codes into GPS coordinates that could be mapped. The raw translated data then required extensive pruning.
“We had a lot of false positives—the program would think that [a data point] was in Australia when it should have been in Brazil,” explained Rothman.
After many meetings and corrections, the project was finished by December 2014, but both Burdumy and Rothman were eager for it to extend beyond the classroom. They launched it through GitHub, a web-hosting and code-sharing platform, and began adding tweaks to make their site user-friendly. The project has now received more than 10,000 page views, thanks, in part, to a good social media buzz.
“I never knew my history professor had such a good Twitter following,” Burdumy said.
After Rothman announced the project through his own feed, the visualization was shared around the world, including a retweet from Slate Vault. It’s also featured on Free Technology for Teachers, a free information and resource-sharing site for teachers at every level.
While the project is now a resource for teachers everywhere, it was also a true learning experience for Burdumy.
“With Professor Rothman, I had an expert I had to bounce things off of and meet with, and it was the first time I had that type of experience. It’s something I think I’ll see in the future,” he said.
After he graduates this month, Burdumy will embark on a two-year position as a 2015 Venture for America Fellow, where he’ll support a startup organization and continue to enhance his portfolio.
And at Georgetown, Rothman will continue not only to use the visualization in his own classroom, but also to encourage students to think outside the box.
“It might inspire other students to do similar kinds of projects. I think students would be surprised at how flexible faculty can be if they’re presented with a really interesting idea that comes from students themselves,” he said. “And faculty should capitalize on the range of talent and skill that our students possess.”
Burdumy, who had never before taken on such a task, agrees. “This was the first time that I developed a project that was outside of what I really knew. I think a lot of Georgetown students couldn’t do something like this without being able to replace some of the academic work,” he said. “But I got way more engaged with and excited about the class as a result.”
Related Information
To hear more from Professor Adam Rothman, connect with him on Twitter: @arothmanhistory